Benchmarking Tool Food Safety Climate
This benchmarking tool is an instrument made for food companies to compare their own food safety climate with a collected food safefety climate sample consisting of 20 food producing companies in Flanders. It is a result from the Q-DNA project (COOCK project, Ghent University and Flanders' FOOD).
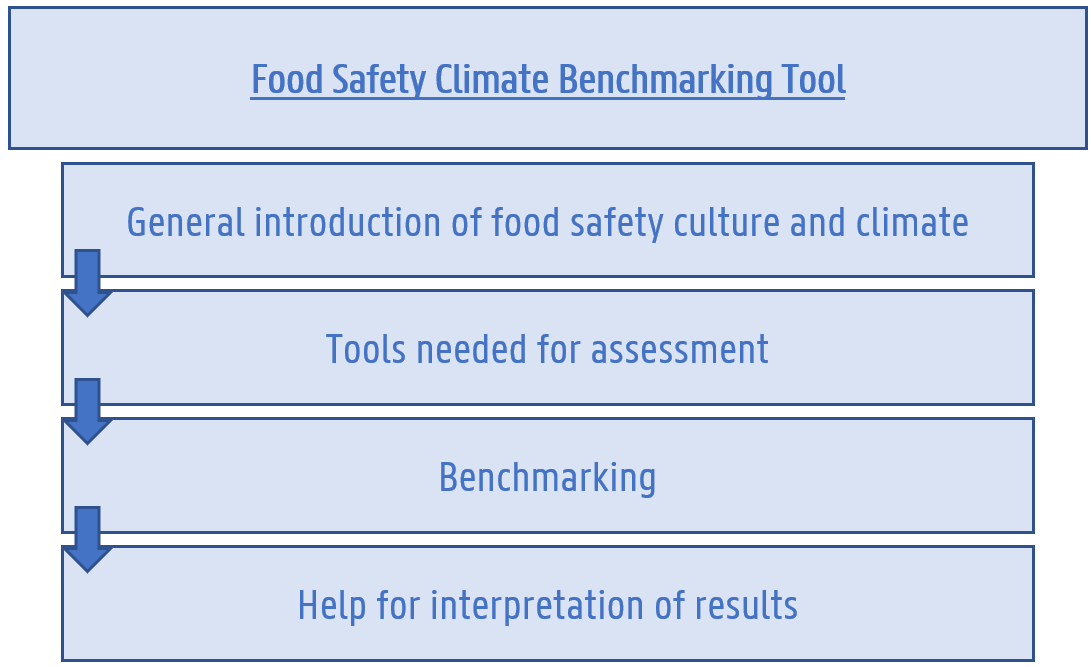
The tool starts with a general explanation of food safety culture and climate (2.Food safety culture and climate). Next, the food safety climate assessment tool is introduced (3.Food safety Climate tool) which can be applied to assess food safety climate in your own company. The next part of this benchmarking tool is the page on which you can fill in your own acquired food safety climate data (4.Benchmarking), with which some automatic calculations will be made and which will be compared to the sample. In other words, the food safety climate data from your own company will be compared with the food safety climate data from the acquired sample (food safety climate data in 20 food companies, from different sectors and sizes, located in Flanders). The final page consists of additional information and examples (5.Interpretation Results Food safety Climate Tool) to help with the interpretation of the figures and calculations made.
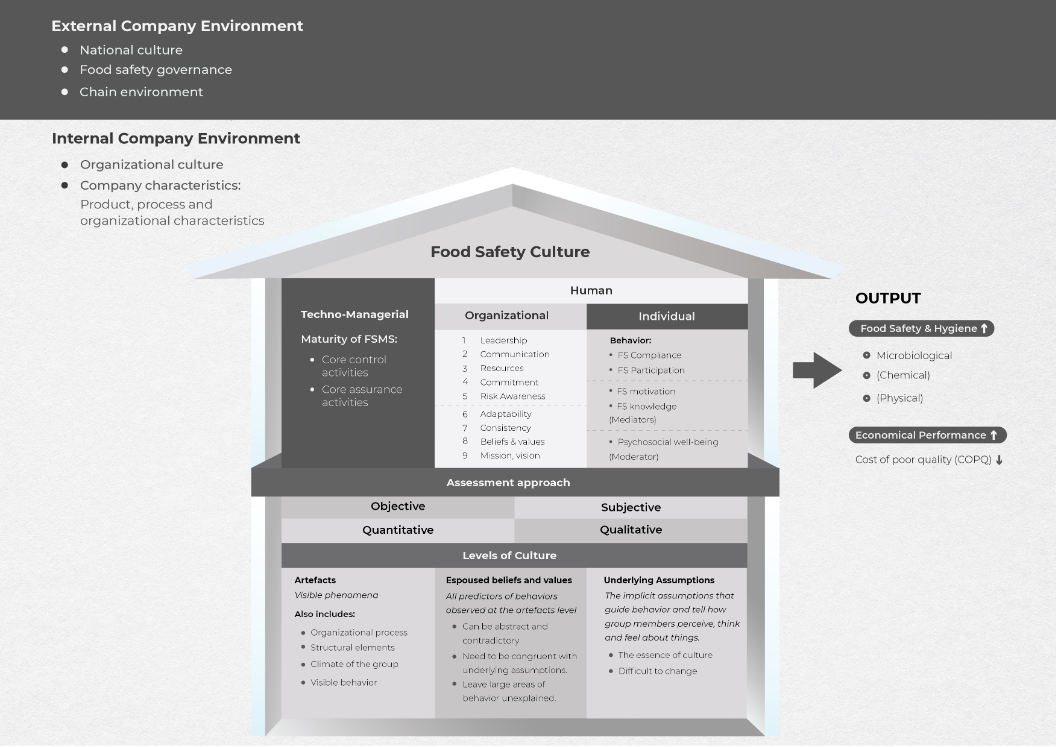
The presented framework presents food safety culture as consisting of three building blocks, namely the FSMS activities (food safety management system), the human organizational and human-individual building block, each with multiple dimensions. Culture can be measured objectively/subjectively and quantitatively/qualitatively. Food safety culture also includes several layers: the artifacts (visible phenomena), the espoused beliefs and values (predictors of behavior at the artifact level), and underlying assumptions (the essence of culture). The model also shows the output of food safety culture, namely a higher level of (microbiological) food safety and an increase in economic health of the company. Finally, the model positions the concept of food safety culture within a broader internal business environment, which is repositioned within an external business environment.
This benchmarking tool is a tool to benchmark food safety climate. There is a clear distinction between food safety culture and food safety climate. Food safety climate can be considered more temporal and is more subject to the perception of individual employees of an organization or company. Food safety culture is then the overarching framework of which food safety climate is a component. The food safety climate tool assesses perceptions on the 5 included dimensions: leadership, communication, commitment, resources and risk awareness (which are part of the human-organizational building block).
3.Food Safety Climate Tool
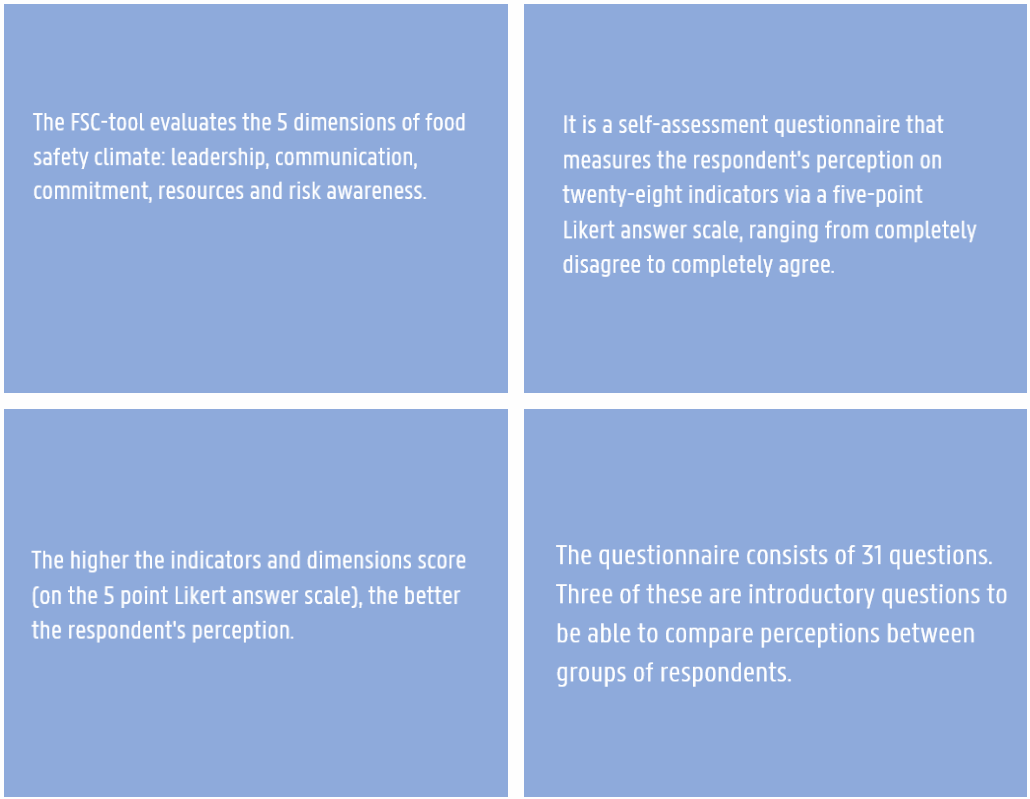
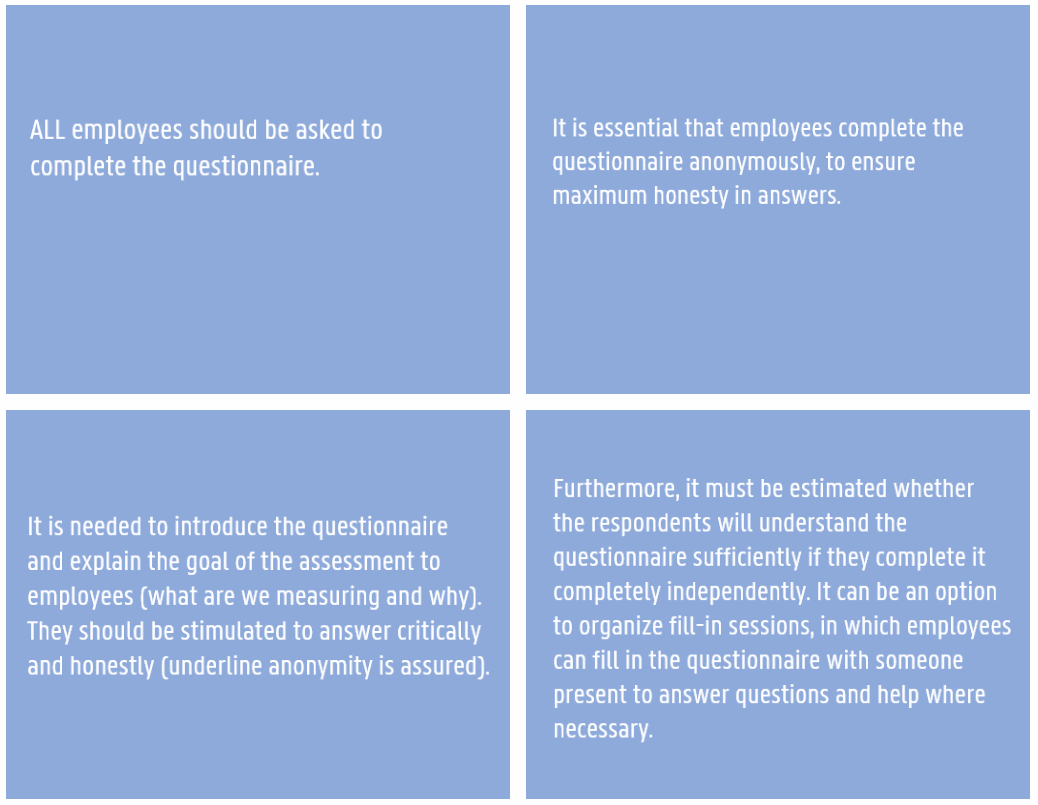
For a strong food safety culture, it is essential to involve all employees. The purchasing department must consider food safety and quality (such as shelf life) when purchasing raw materials, the sales department must take into account food safety requirements when selling and ensure that sales promises remain feasible and safe, HR must take food safety knowledge into account when recruiting, and so on. Food safety should become a shared responsibility. For that reason, the FSC-tool must be completed by all employees in the organization. Everyone should be involved and everyone's perception should be considered. A response rate of 70% should be pursued for a representative result.
Since the food industry is known to be a multicultural environment, translations of the questionnaire are provided (Dutch, English, French and Arabic). Furthermore, there are some practical matters to consider:
Questionaires
4.Benchmarking Tool
The following link will lead you to the benchmarking tool, which you can use to compare your acquired food safety climate data from your company, with the collected sample. It will also give you an overview of your own food safety climate results. The sample contains food safety climate data from 20 food companies located in Flanders.
If you click the link, you will be redirected to Microsoft Excel online.
You will have to download the excel file to your computer before you can edit it.
The first step is to add your collected data in the first sheet: 'data input'. Every row in the file is a respondent, you should fill in the answers of each respondent. Q1 to Q31 means question 1 to question 31 from the questionnaire. The first 2 rows are filled in as an example, this example should be erased and replaced with your own data of the first two respondents.
The Excel fill will automatically compare your data to the sample by producing radar charts. Help with the interpretation of the results is provided in the next section (5.Interpretation Results Food safety Climate Tool). When adding the data in the file, please keep in mind to:
Only fill in answers on a scale from 1 to 5, no decimal points.
Do not leave any cells in blank in a respondent's answer row. All questions have to be answered, otherwise this will influence the calculation's results.
For the introductory questions, only fill in allowed values (yes/no or fixed/open).
5.Interpretation of results benchmarking tool
The benchmarking tool will give you two main results.
The first section of the results provided is about your own food safety climate, not yet compared to other companies. These results are provided in the sheet 'Food Safety Climate Results'. In this sheet:
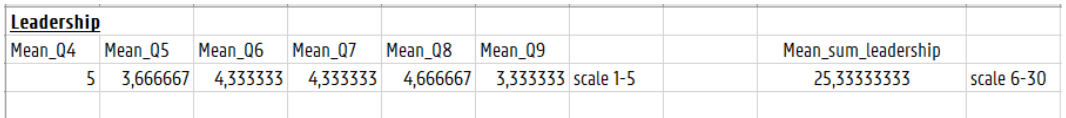
the first part is a table which displays the average of the respondents' answers for each question, for each dimension. The example below displays the results for the dimension Leadership. Mean_Q4 to Mean_Q9 are the mean values of answers given by respondents on a scale from 1 to 5, for each question.
Next to this, the sum is calculated for each respondent for each dimension. For leadership, this is the sum of questions 4 to 9. The result in the table below is the mean (of all respondents) of the sum of the questions belonging to the dimension leadership. For facilitating interpretation, the scale is also always mentioned. The rule is always: the higher the number, the better the perception of the question/dimension.
Next, some comparisons of perception between groups are made, based on the three included introductory questions in the questionnaire (i.e. leader/non-leader, direct contact with food/no direct contact with food, type of contract). The image below shows the comparison of mean sumscores for each dimension, between leaders and non-leaders. If the line of the non-leaders is more outwards in the figure than the line of the leaders, this means non-leaders have a better perception for this dimension, compared to leaders.

The second part of the results given in the tool are the benchmarking results. These are displayed in the sheet 'Benchmarking Results'. Here, your data is compared to the sample collected in the Flemish food industry. The example of the dimension 'communication' is given below:
Each question belonging to the dimension communication (question 10 - 14) is displayed, with the orange line representing the database and the blue line representing the input data of your own company.
The more towards the outside of the figure the line is situated, the better the perception.
If the blue line is displayed more towards than the orange line, this means the perception of the questions is better in your company, compared to the sample (or the other way around).

Acknowledgements
This research was funded by Agentschap Innoveren en Ondernemen (COOCK project), as part of the Q-DNA project (HBC.2020.2738), which is a collaboration between Ghent University and Flanders' FOOD. We acknowledge and thank all the 20 companies who made it possible to make a database for this benchmarking tool, and all participants for their input during this study.
For questions, you can contact Liesbeth.Jacxsens@UGent.be
